
Understanding ERMI and MSQPCR Mold Testing
ERMI, also known as MSQPCR, is one of the most recognized mold tests available today. Both methods use quantitative DNA qPCR technology to measure the concentration of individual mold species in a sample.
The difference is simple:
- ERMI includes an overall score
- MSQPCR reports individual mold
ERMI, also known as MSQPCR, is one of the most recognized mold testing methods available today. Both methods use quantitative DNA qPCR technology to measure the concentration of individual mold species in a sample.
The difference is simple:
ERMI includes an overall score
MSQPCR reports individual mold species without an overall score
While the ERMI score can be a useful starting point, the most important part of the report is the individual species breakdown.
Focus on Individual Mold Species
Rather than relying only on the total ERMI score, it is important to review each mold species listed in the report. This provides a clearer understanding of the indoor environment and helps identify mold concerns related to water damage.
The score is a calculated number designed to simplify interpretation. However, individual species findings are extremely important and should always be considered, with special attention given to the Group 1 species.
Our reports also use quartile levels to highlight the concentration of each species:
- Q1
- Q2
- Q3
- Q4
Any species in the Q4 range is considered clearly elevated and should be investigated, especially when health concerns are present.
These quartile levels are based on data collected from 5,000 homes across the United States.
Group 1: Water-Damage-Associated Mold
Group 1 includes 26 mold species associated with water-damaged environments. These species are considered the most important part of the report when evaluating potential indoor mold problems.
Special attention is often given to the Big 5 species, which are also used in the HERTSMI-2 evaluation.
Report Indicators
In the report:
- Red boxes indicate elevated concern
- Star symbols show how far levels exceed normal ranges:
- 1 star (*) = 10 times normal
- 2 stars (**) = 100 times normal
- 3 stars (***) = 1,000 times normal
Ideal Results
The goal is to have:
- Most species in the green range
- No species in the red range
- Ideally, only 2 to 3 species in the yellow range
Group 2: Indoor Control Group
Group 2 serves as the indoor control group and is used primarily to establish a baseline and calculate the ERMI score.
Although Group 2 is important for scoring purposes, the report should still be interpreted with the greatest emphasis on the individual species in Group 1, not just the overall ERMI number.
What to Do if Elevated Mold Levels Are Found
If a species is flagged at an elevated level, the next step is to identify the source of the contamination.
Areas worth inspecting include:
- Beneath floating floors
- Behind air conditioning coils
- Areas with past or present water damage
- Crawl spaces
- Behind drywall in kitchens and bathrooms
These hidden spaces are common locations for mold growth and should be examined carefully.
Recommended ERMI Targets
Recommended ERMI targets may vary depending on individual sensitivity:
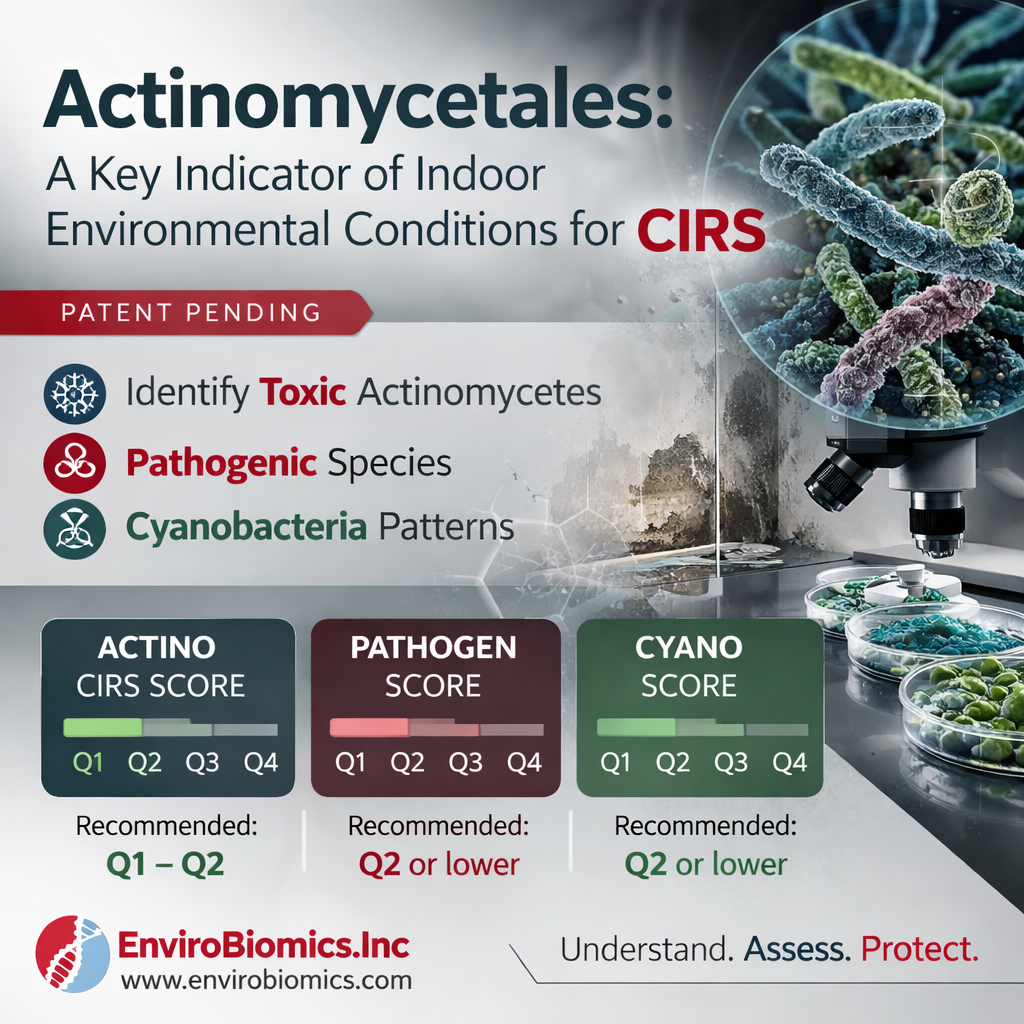
- ERMI of 2 or lower is often recommended for individuals with mold sensitivity or Chronic Inflammatory Response Syndrome (CIRS)
- ERMI of 5 or lower is commonly considered acceptable for the general population
Even so, the overall score should never replace a careful review of the individual species results. A stronger report is one in which species remain mostly in the green zone, with little to no yellow and none in red.
For example, based on the 2021 EPA home survey, some mold species should measure 1 or less, and any elevation may be a warning sign even when the overall ERMI score appears normal.
Reference Data Used in the Report
The ERMI and HERTSMI-2 report is based on AHHS2, which uses reference data from the EPA’s 2021 housing survey for homes built after 1978.
The EPA also published AHHS1, which applies to homes built before 1978. Reference data for older homes is available separately on our website.
The tables below provide a summary of the EPA home surveys:
GM = Geometric Mean
% Occur = Percentage of Occurrence
EPA Home Survey Summary — Group 1
| Species | % Occur 1 | % Occur 2 | GM 1 | GM 2 |
|---|---|---|---|---|
| Aspergillus flavus | 36 | 47 | 2 | 1 |
| Aspergillus fumigatus | 62 | 70 | 3 | 2 |
| Aspergillus niger | 69 | 97 | 4 | 18 |
| Aspergillus ochraceus | 27 | 74 | 2 | 3 |
| Aspergillus penicillioides | 90 | 99 | 91 | 140 |
| Aspergillus restrictus | 12 | 76 | 2 | 6 |
| Aspergillus sclerotiorum | 26 | 54 | 2 | 2 |
| Aspergillus sydowii | 29 | 6 | 3 | 6 |
| Aspergillus unguis | 20 | 36 | 2 | 1 |
| Aspergillus versicolor | 30 | 70 | 2 | 14 |
| Aureobasidium pullulans | 94 | 100 | 263 | 335 |
| Chaetomium globosum | 51 | 72 | 2 | 3 |
| Cladosporium sphaerospermum | 82 | 98 | 13 | 47 |
| Eurotium amstelodami | 98 | 100 | 155 | 71 |
| Paecilomyces variotii | 46 | 64 | 2 | 2 |
| Penicillium brevicompactum | 52 | 89 | 5 | 6 |
| Penicillium corylophilum | 17 | 68 | 2 | 4 |
| Penicillium group 2 | 8 | 63 | 1 | 6 |
| Penicillium purpurogenum | 15 | 25 | 1 | 1 |
| Penicillium spinulosum | 20 | 5 | 1 | 1 |
| Penicillium variabile | 50 | 87 | 3 | 6 |
| Scopulariopsis brevicaulis | 53 | 64 | 2 | 2 |
| Scopulariopsis chartarum | 38 | 75 | 2 | 3 |
| Stachybotrys chartarum | 35 | 38 | 2 | 1 |
| Trichoderma viride | 27 | 78 | 2 | 3 |
| Wallemia sebi | 75 | 100 | 18 | 155 |
EPA Home Survey Summary — Group 2
| Species | % Occur 1 | % Occur 2 | GM 1 | GM 2 |
|---|---|---|---|---|
| Acremonium strictum | 57 | 82 | 4 | 7 |
| Alternaria alternata | 88 | 100 | 35 | 75 |
| Aspergillus ustus | 40 | 60 | 2 | 2 |
| Cladosporium cladosporioides 1 | 99 | 100 | 331 | 892 |
| Cladosporium cladosporioides 2 | 70 | 95 | 4 | 13 |
| Cladosporium herbarum | 84 | 99 | 31 | 180 |
| Epicoccum nigrum | 93 | 98 | 117 | 59 |
| Mucor racemosus | 92 | 97 | 15 | 17 |
| Penicillium chrysogenum 2 | 66 | 95 | 5 | 24 |
| Rhizopus stolonifer | 29 | 52 | 1 | 2 |


